Real Trading Methods: Harmonic Patterns + Classical Technical Analysis

By Leslie Jouflas, CMT | July 30, 2023

1-Hour Presentation Combining Harmonic Trading Patterns and Classical Technical Analysis

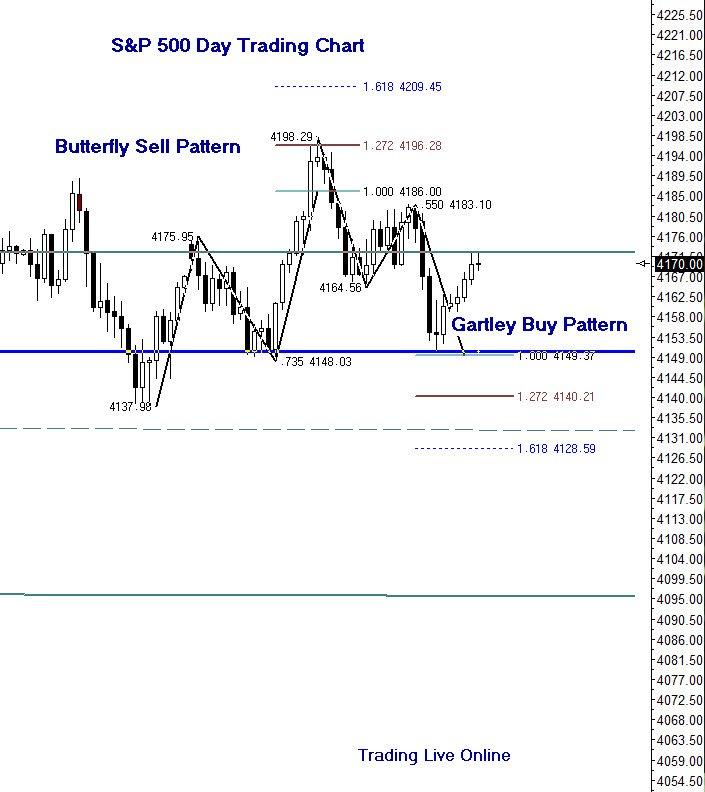
Develop the Right Mindset to Trade Powerful Butterfly Reversal Patterns.

By Leslie Jouflas, CMT | April 26, 2023

Webcast May 2, 2023, 3PM ET/12PM PST

Presented by Leslie Jouflas, CMT

Sign-up Link

https://xs224.isrefer.com/go/streg/stxtradingliveonline/
Click below to view how I use the Relative Strength Index (RSI) to analyze the major Stock Indexes on this segment of ‘Your Daily 5’, for StockCharts

By Leslie Jouflas, CMT | March 1, 2023

Your Daily Five Video Here

Power Patterns for All Markets: Ranges vs Trends

By Leslie Jouflas, CMT | December 2, 2022

(400) ⏰ Synergy Traders #42.34: Identifying Range Trading versus Trend Trading with Leslie Jouflas, CMT – YouTube

Nature, Art…and Math. Fibonacci Day.

By Leslie Jouflas, CMT | November 23, 2022
November 23, 2022, Fibonacci Day

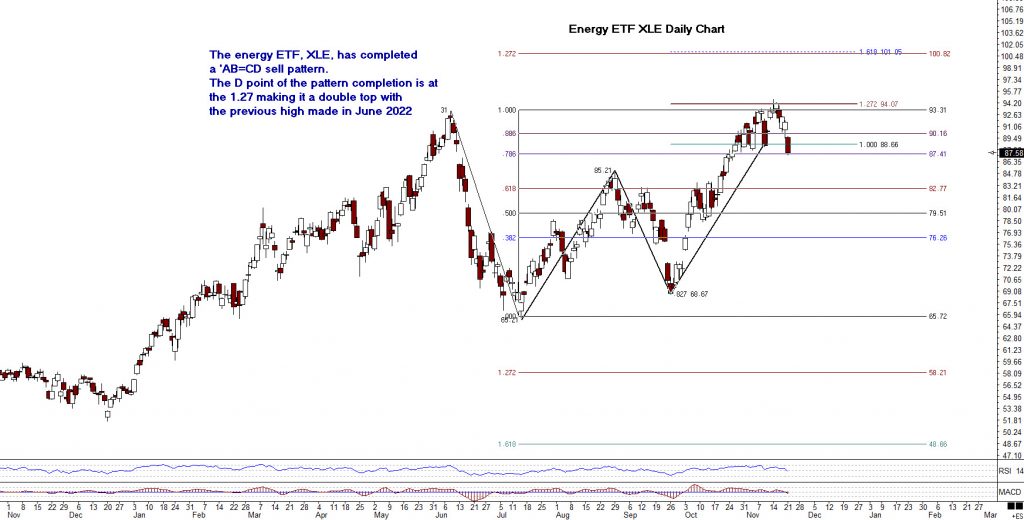
Where Are Energy Stocks Headed? This Chart Shows An AB=CD Double Top Sell Pattern.

By Leslie Jouflas, CMT | November 21, 2022
XLE Daily Chart shows an AB=CD Double Top Sell Pattern. Other energy related assets likely show corresponding patterns.

Stock Market Indexes Bounce, Now Where?

By Leslie Jouflas, CMT | October 25, 2022

Learn These Price Characteristics Around the FOMC Meetings. Part II.

By Leslie Jouflas, CMT | September 23, 2022
Trading tendencies around FOMC meetings Part II

Learn These Price Characteristics Around the FOMC Meetings. Part I.

By Leslie Jouflas, CMT | September 23, 2022
Part I of II highlighting price behavior and characteristics for stock and futures traders

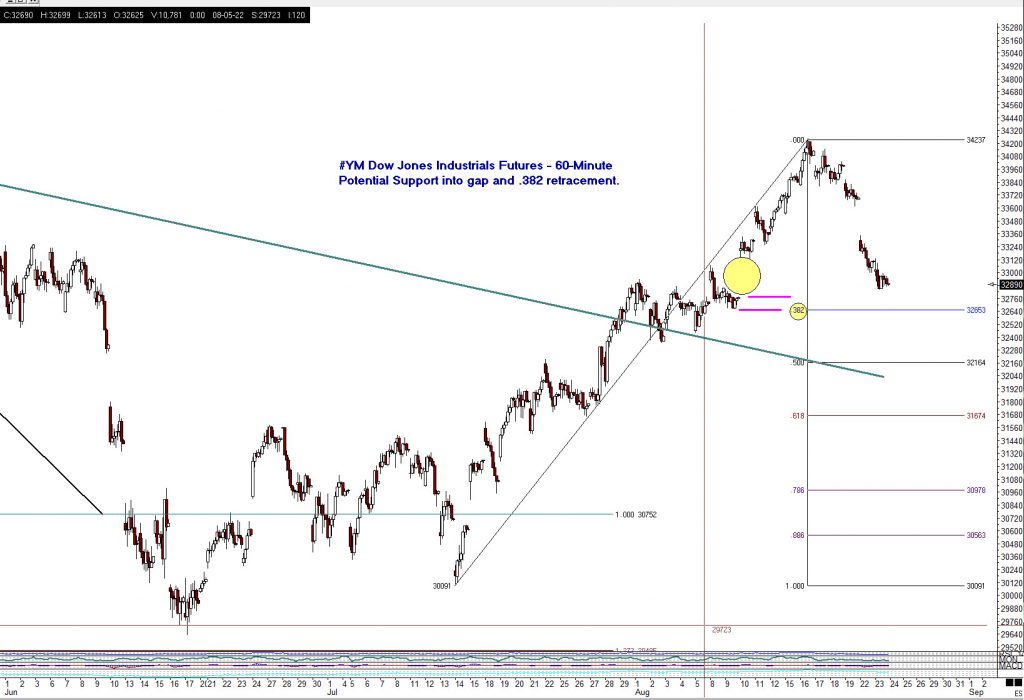
Where is Potential Support for the Dow Jones Industrials eMini. See chart below.

By Leslie Jouflas, CMT | August 23, 2022
Potential support for the #YM Emini contract around the .382 and gap area, shown in yellow on the chart. The next level below would be at the .50 retracement that coincides with the downward sloping trend line, shown on the chart.