NASDAQ Is the Chart of the Day. Find Out What Pattern Preceded the Sell-Off.

By Leslie Jouflas, CMT | August 8, 2022
August 8, 2022, NASDAQ 5-Minute Butterfly Sell Pattern

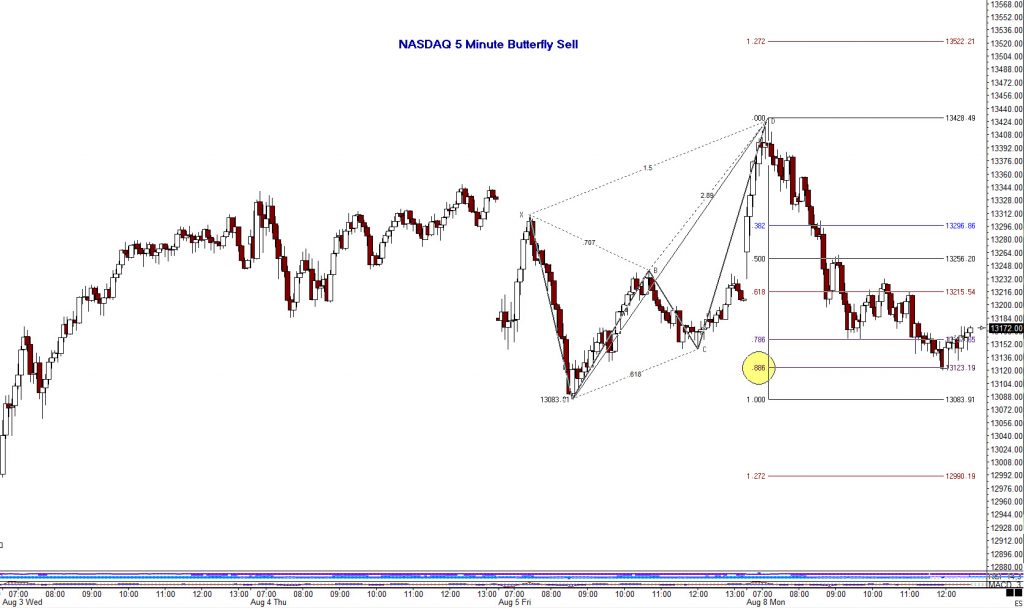
The NASDAQ is a widely traded asset. Harmonic patterns such as this Butterfly reversal sell pattern, are staple patterns which form consistently, especially on intraday time frames. Notice the .886 retracement where the index found support, this is now a key level to monitor.

Find Out How Harmonic Swings Can Help Traders Understand Markets.

By Leslie Jouflas, CMT | August 1, 2022

https://stockcharts.com/articles/tac/2020/05/learn-harmonic-swings-and-the-824.html

After a Parabolic Top, Crude Oil and Energy Markets are Having a Short-Term Bounce.

By Leslie Jouflas, CMT | July 26, 2022

Where is Amazon Stock Headed, Plus Updates for the S&P 500.

By Leslie Jouflas, CMT | July 13, 2022

Here’s What You Need to Know to Day-Trade Trends in the S&P 500 Futures Market — COPY

By Leslie Jouflas, CMT | June 28, 2022

Method and Mindset Must Blend Together. Watch This Video to See How Many Skills Trading Requires.

By Leslie Jouflas, CMT | June 5, 2022

Stock Market Indexes are Testing Important Lows. Find Out What Price Levels to Watch!

By Leslie Jouflas, CMT | May 20, 2022

Head and Shoulders Chart Pattern. Find Out Where the Markets Might be Headed.

By Leslie Jouflas, CMT | May 3, 2022

These Tech Giants Have Seen Better Days…

By Leslie Jouflas, CMT | April 12, 2022

Here’s the Important Levels I’m Watching in the Stock Market Indexes!

By Leslie Jouflas, CMT | March 22, 2022