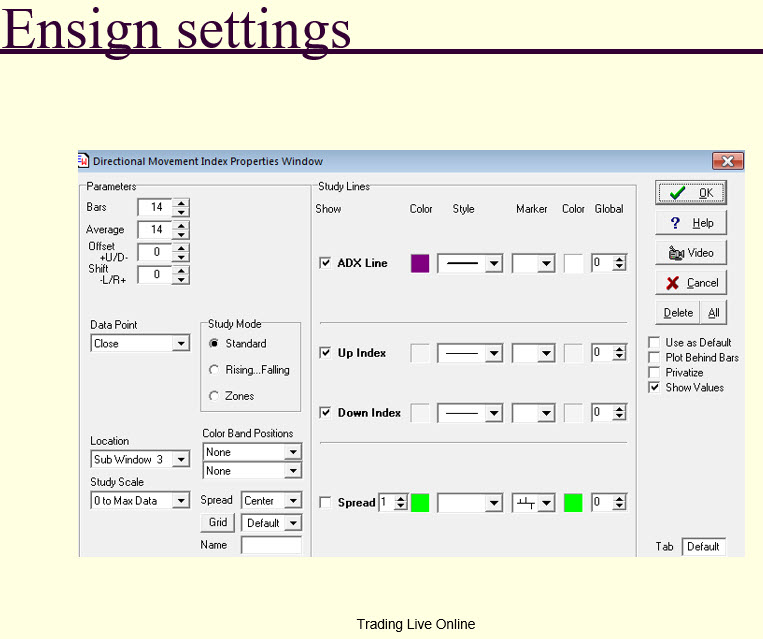
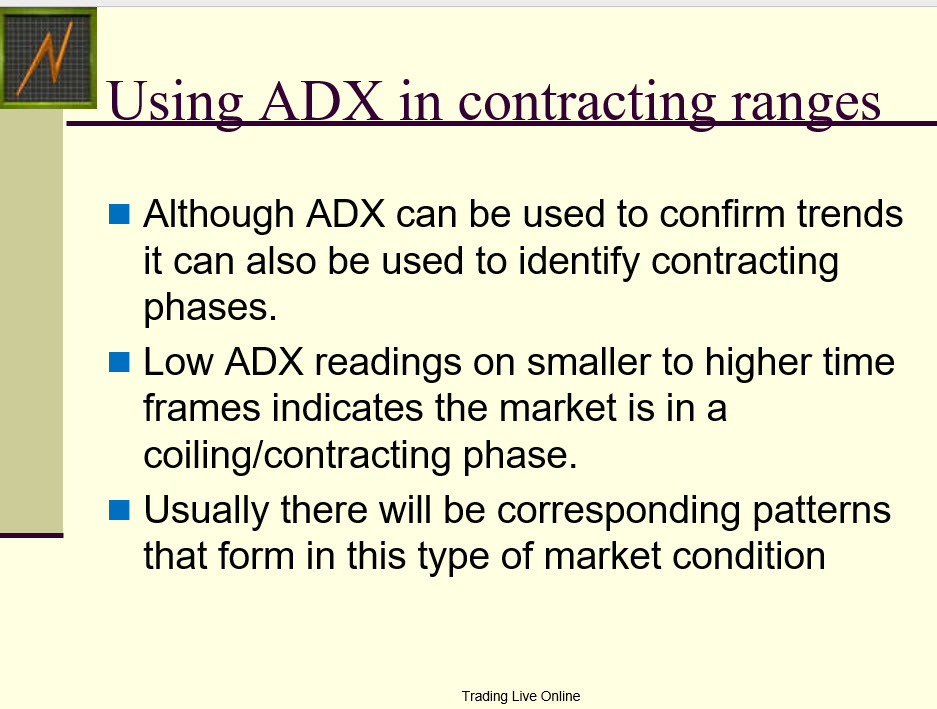
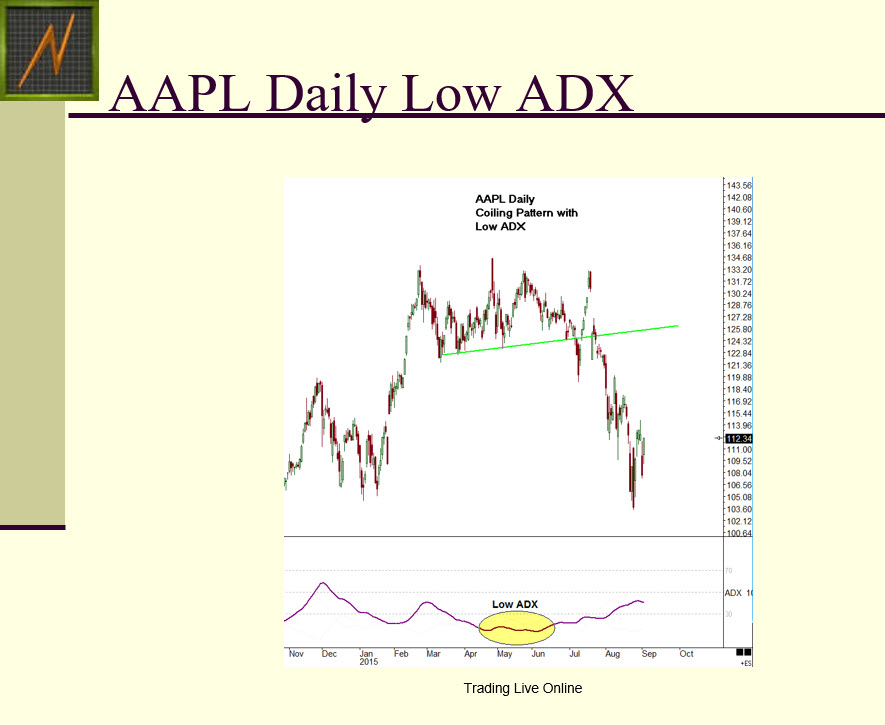
Indicators Part 3 – Advanced Directional Movement (ADX). Contraction and Expansion.
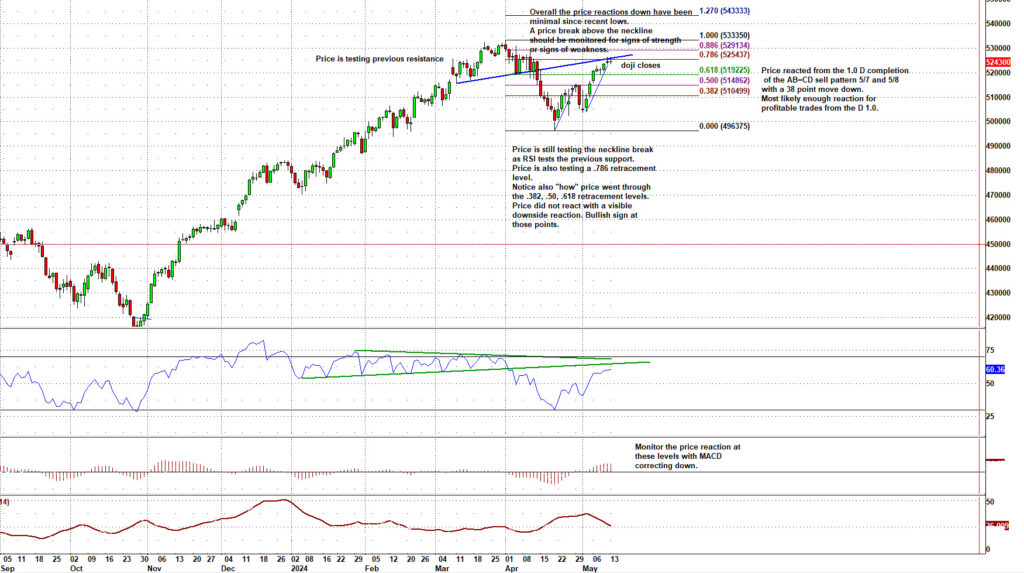
May 14, 2024, current S&P 500 chart with price and RSI tests of resistance with an AB=CD sell pattern.
Technical Trading Mastery
May 14, 2024, current S&P 500 chart with price and RSI tests of resistance with an AB=CD sell pattern.