Learn These Price Characteristics Around the FOMC Meetings. Part I.

Part I of II highlighting price behavior and characteristics for stock and futures traders

Where is Potential Support for the Dow Jones Industrials eMini. See chart below.

Potential support for the #YM Emini contract around the .382 and gap area, shown in yellow on the chart. The next level below would be at the .50 retracement that coincides with the downward sloping trend line, shown on the chart.

Major Stock Indexes Traded to Upside Resistance. See How a Simple Trend Line Found It.

Looking For Stocks in A Recession? Watch Video to Find Out What You Should Look For.

NASDAQ Is the Chart of the Day. Find Out What Pattern Preceded the Sell-Off.

August 8, 2022, NASDAQ 5-Minute Butterfly Sell Pattern

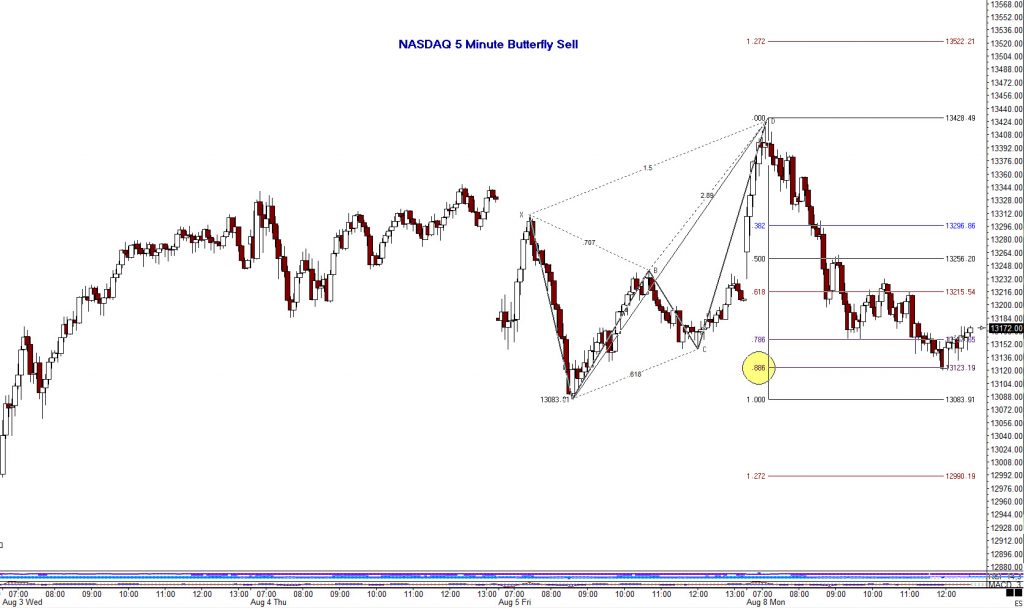
The NASDAQ is a widely traded asset. Harmonic patterns such as this Butterfly reversal sell pattern, are staple patterns which form consistently, especially on intraday time frames. Notice the .886 retracement where the index found support, this is now a key level to monitor.

Find Out How Harmonic Swings Can Help Traders Understand Markets.

https://stockcharts.com/articles/tac/2020/05/learn-harmonic-swings-and-the-824.html

After a Parabolic Top, Crude Oil and Energy Markets are Having a Short-Term Bounce.

Where is Amazon Stock Headed, Plus Updates for the S&P 500.

Here’s What You Need to Know to Day-Trade Trends in the S&P 500 Futures Market — COPY

Method and Mindset Must Blend Together. Watch This Video to See How Many Skills Trading Requires.